Review of 1Q 2024: S&P 500 at All-Time Highs
- Three themes continue to dominate markets in 2024:
- Artificial Intelligence
- Federal Reserve
- Inflation
- The S&P 500 had its best start to the year since the first quarter of 2019 (+13.6%).
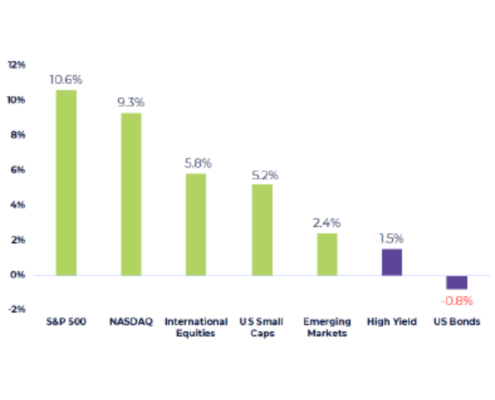
- Valuations remained attractive for small caps and stocks outside the “Magnificent 7” heading into 2024. While certain Big Tech stocks stumbled in Q1, (i.e. Tesla, Apple), the S&P 500 index rallied 10.6%. Small Caps were also positive (+5.2%) on the hopes
for a “soft landing.” - After a dramatic fall in yields late last year, we expected yields to rebound as inflation remained sticker and the Fed pushed out rate cuts. The 10-year treasury yield rebounded from 3.9% to 4.2%.
- Equity volatility remained very low in 2023, with only two trading days that saw +/- 2% moves for the S&P 500. This trend surprisingly continued in the first quarter of 2024, with only one +/- 2% trading day (the S&P 500 was up +2.1% on February 22nd). The S&P 500 has not had a one-day decline of 2% or worse since February 2023.
- Stickier inflation and rising yields led to underperformance of core Fixed Income
versus High Yield and shorter-duration bonds in Q1. The Bloomberg US Aggregate
Bond index finished down -0.8% in Q1.
Source: Bloomberg, Morningstar Direct and Dynasty Financial Partners
As of 3/31/2024
International Equities: MSCI EAFE, US Small Caps: Russell 2000, High Yield: Bloomberg US High Yield 2% Issuer Cap, Emerging Markets: MSCI EM, US Bonds: Bloomberg US Agg Bond
Still Early Innings of the AI Revolution?
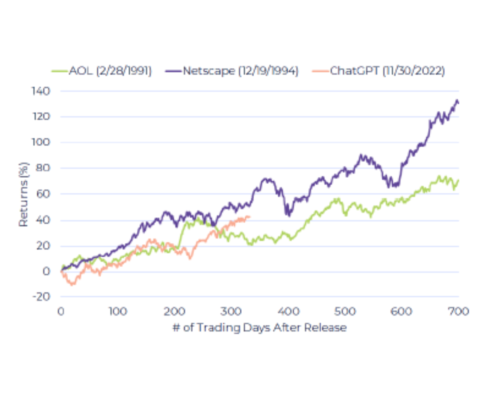
It has been over 330 trading days since the release of ChatGPT, which officially started the boom in Artificial Intelligence. Since its release, the Nasdaq has rallied over 40%.
Many have compared the current AI revolution to the 1990s and the beginning of the Internet. Below we highlight ChatGPT against two major product releases in the 1990s: 1) “Netscape” Web Browser in 1994 and 2) America Online (AOL) in 1991.
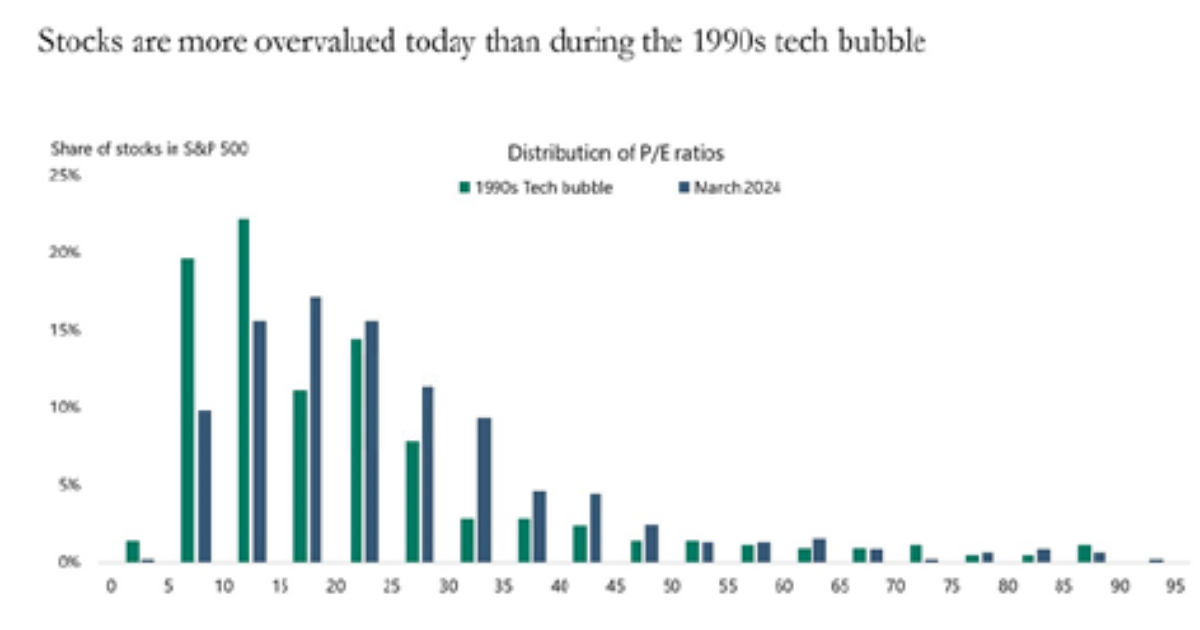
As shown to the right, performance of the Nasdaq after the release of all three products has been remarkably similar (so far). However, when we compare the two time periods, the distribution of P/E ratios for the S&P 500 shows that stocks today are more overvalued than they were in March 2000 as shown to the left.
Source: Apollo
Nasdaq % Change After Major Tech Release Dates
Source: Bespoke Investment Group, YCharts and Dynasty Financial Partners
As of 3/31/2024
Performance of the Nasdaq Composite after specific release dates of major products
Big Tech Dominating Respective Industries
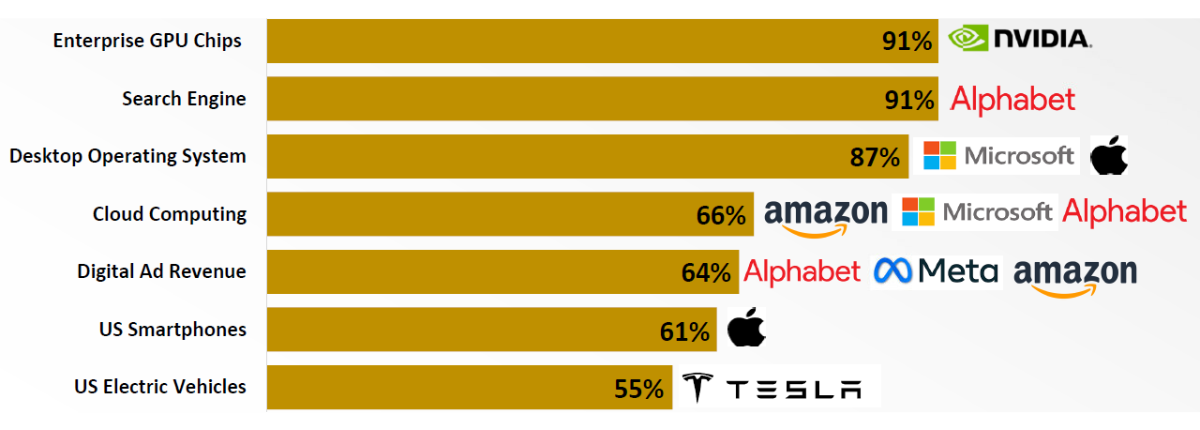
Big Tech’s dominance in industries with high growth and/or margins has helped fuel its recent outperformance. For example, Nvidia has over a 90% market share in GPU chips that help power applications for Artificial Intelligence. The strength of these top companies have also raised concerns of regulators (both home and abroad). For example, Apple was recently hit with a US antitrust lawsuit from the US Department of Justice.
Estimated Market Share of Respective Industries/Products
Source: IDC, Statista, StatCounter, Counterpoint and Cox Automotive Data is global market share unless explicitly stated otherwise
As of 3/31/2024
Key Indicators Signal a “Soft Landing”…
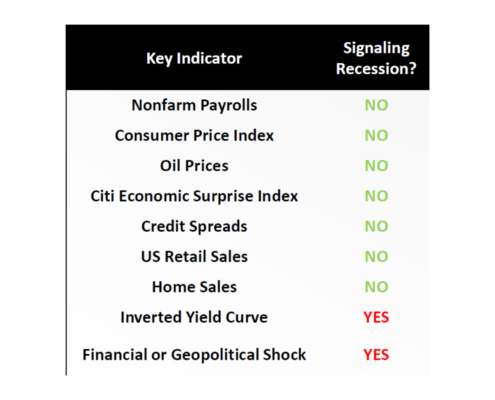
- The market continues to price in a “soft landing” in part due to a) Strong Labor Market, b) Narrow Credit Spreads, and c) Resilient Consumer & Housing Market
- Despite the most aggressive tightening cycle in four decades, which saw the Fed raise its Target Rate by 5.25% between March 2022 and July 2023, the economy has stayed more resilient than most have expected. How come?
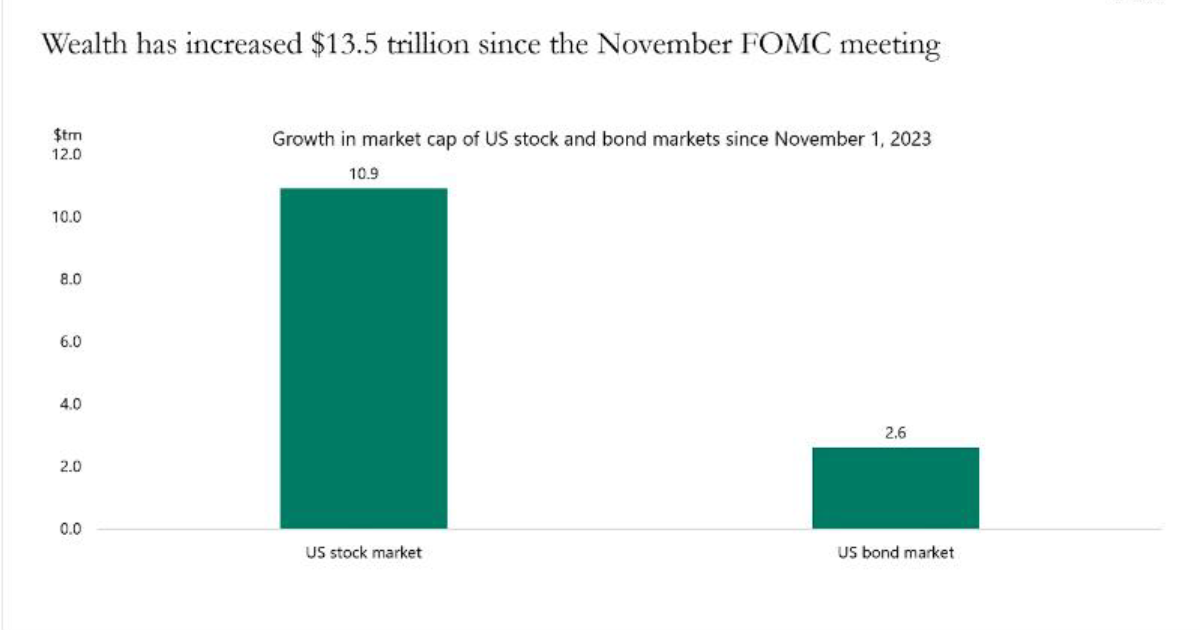
- One significant factor could be the wealth effect: The S&P 500 is up 25% since the November FOMC meeting. That is a $10.9 trn increase in the market cap of the S&P 500 in five months. Similarly, with lower rates and tighter credit spreads, the market cap of the US bond market is up $2.6 trn. That’s a total increase in wealth since the Fed pivot of $13.5 trn, excluding any gains from increasing home and Bitcoin price. For comparison, US consumer spending in 2023 was $19 trn
- The bottom line is that the wealth gain experienced for US households since the Fed pivot is at least 70% of consumer spending, and this has been a strong tailwind for private consumption
Source: Apollo
Source: Bloomberg and Dynasty Financial Partners As of 3/31/2024
… Or perhaps a “Delayed Landing”?
- Yet, the biggest recession risk continues to be a re-acceleration in inflation which could result in no rate cuts in 2024 or even additional rate hikes. This remains a lower probability event but our main tail risk for the markets
- If we are indeed in this “Delayed Landing” scenario, the economy would be exposed to higher rates and higher inflation for longer. In turn, this would increase the probability of an eventual landing to be a “hard” one
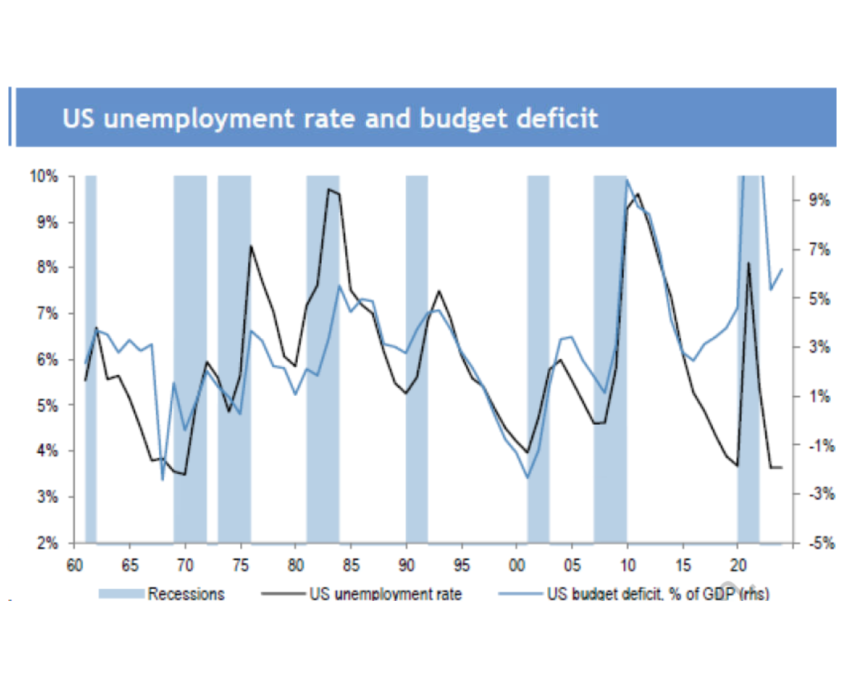
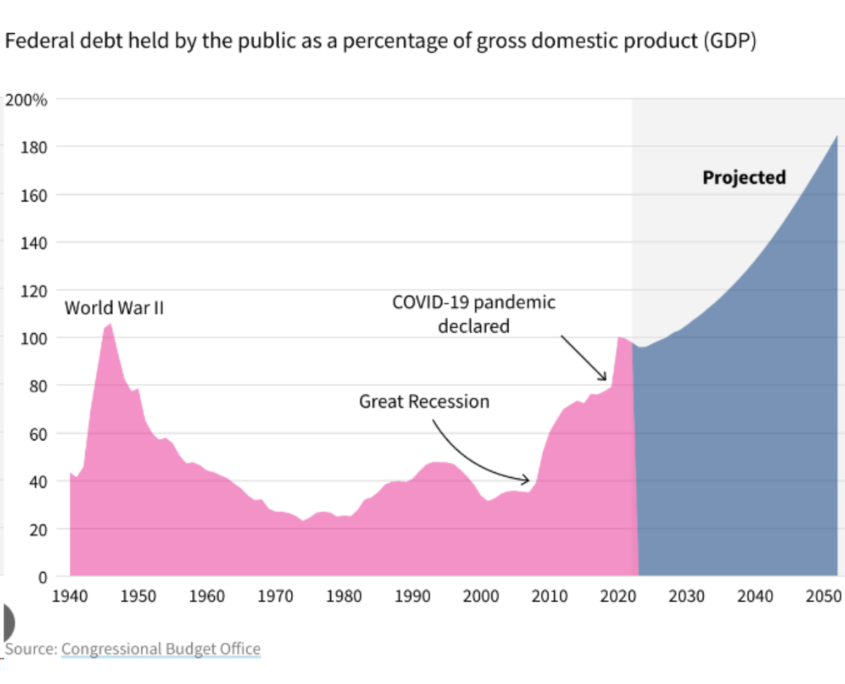
- Another cause for concern is the strong correlation between persistent budget deficits and rise in unemployment and the significant increase in public debt (see below)
- Geopolitical shocks (e.g. War in the Middle East) also could tip the US into a Recession
Source: JP Morgan

Source: Nuveen
Source: CBO
The Fed Still Expects* Rate Cuts in 2024
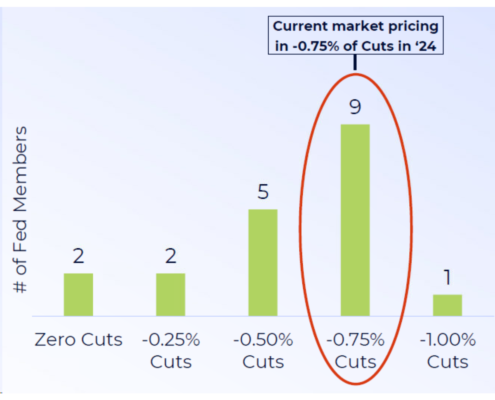
- Despite stickier inflation and a resilient economy, the Fed reinforced they still expect rate cuts in Rate Cuts in 2024 (basis points) 2024 after their March FOMC meeting. Fed provided its updated “Dot Plot” – which summarizes where FOMC members expect the Fed Funds Rate to finish in 2024:
- As shown to the right, a majority (9) of FOMC members expected 75 basis points of cuts in 2024. The Fed also provided a rosier forecast for the economy in 2024. GDP forecasts were raised to 2.1% from 1.4%, while forecasts for the Unemployment Rate were slightly lowered to 4.0% from 4.1%
- Yet, after the March CPI data surprised to the upside, a number of Fed officials including Chair Powell have changed their tone:* Powell said at a panel discussion that restrictive policy needs more time to work since recent data has not shown progress on the inflation front
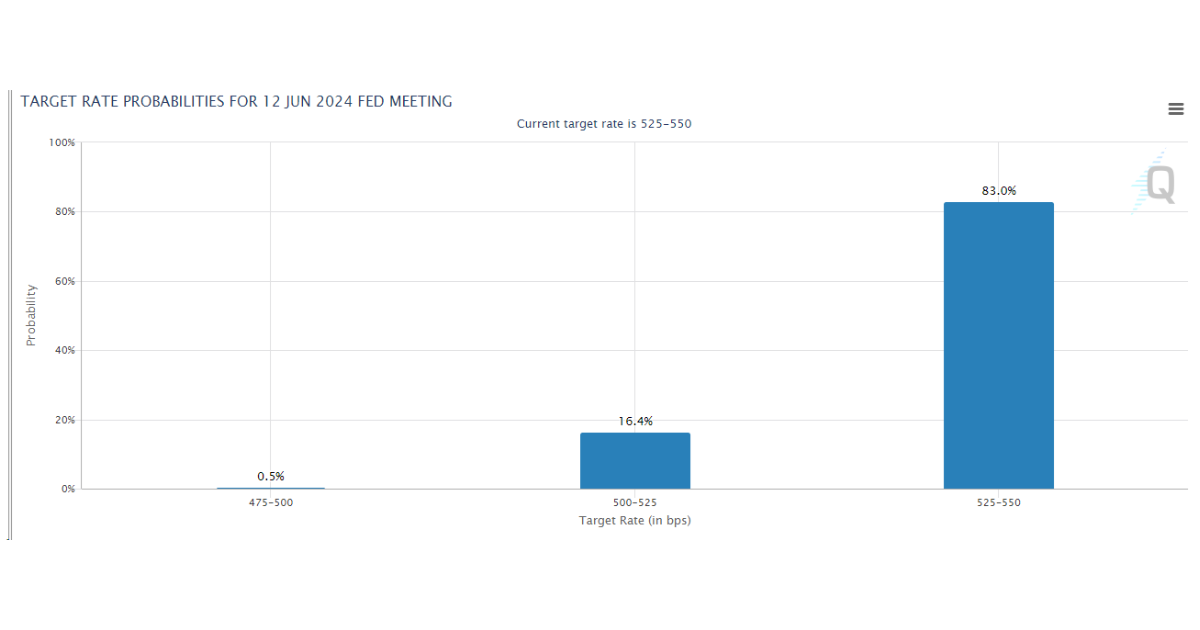
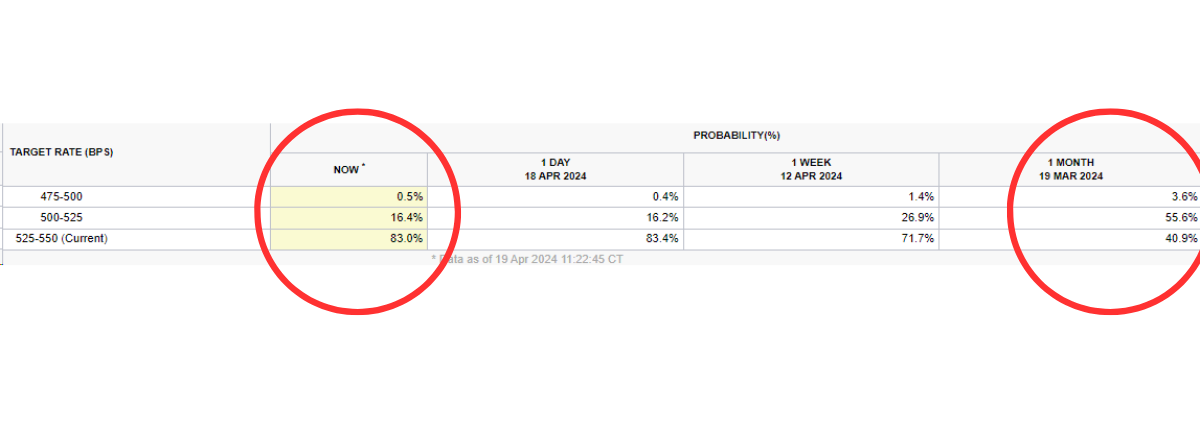
- The market has also changed rate cut expectations for June and the Treasuries have sold off
Fed “Dot Plot” Rate Cuts in 2024 (basis points)
Source: JP Morgan
Source: JP Morgan
Historically How Long Until the Fed Cuts?
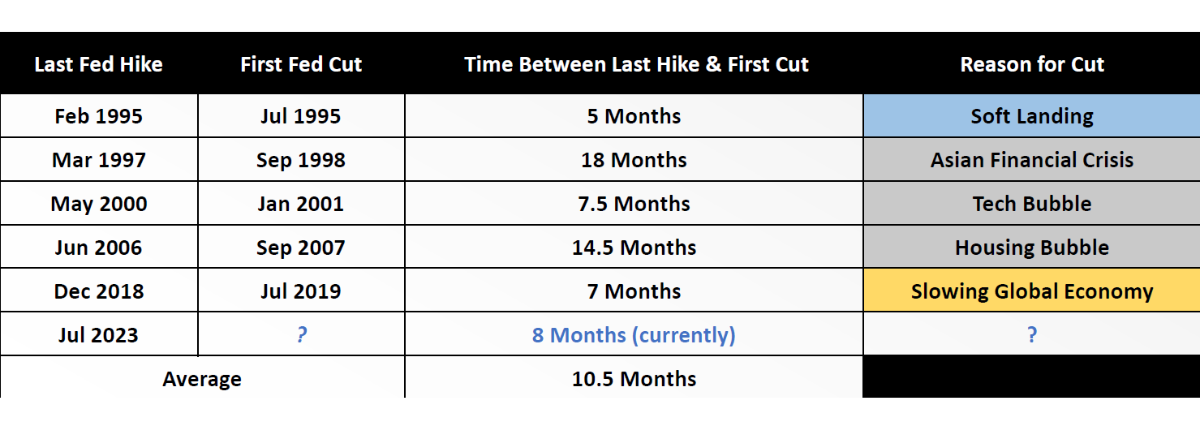
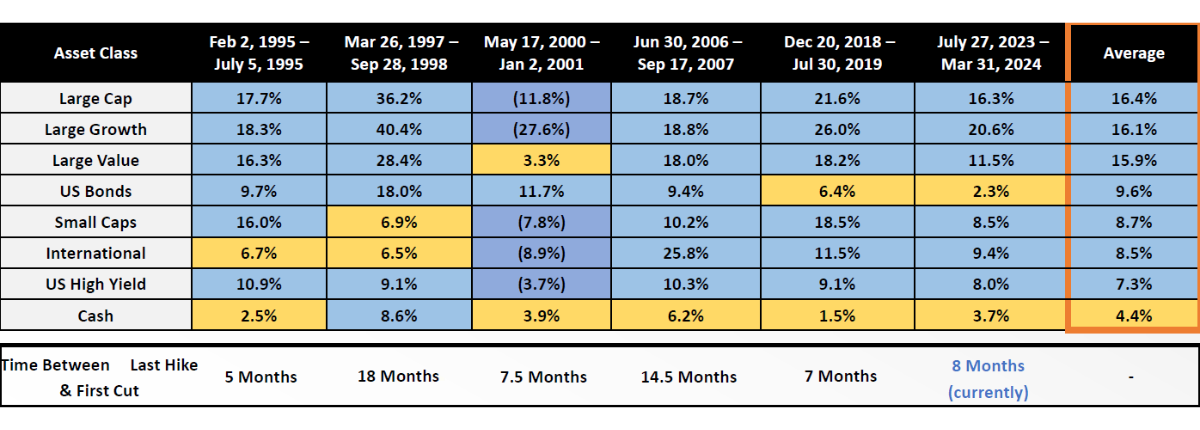
The market remains focused on when the Fed will begin cutting interest rates. In looking back over the past 30 years, the Fed has averaged roughly 10 months between the last hike and first cut. It’s important to note the Fed has historically cut as early as 5 months after the last hike, and as late as 18 months (dating back to 1995).
Given stickier inflation and a resilient labor market, it’s more likely the Fed waits to cut rates until the second half of 2024 if at all.
Source: US Federal Reserve, Bloomberg and Dynasty Financial Partners
As of 3/31/2024
Investment Implications
- Be prepared for higher rates for longer: Despite the recent sell-off in Treasuries, the market has not quite adjusted to the increased probability for stickier inflation and higher rates for longer. Potential softer earnings growth and continued adjusting to structurally higher long-term interest rates may challenge all risk assets
- Recommend OW US Large Caps during a Fed pause, leaning into AI… US Large Cap stocks with high quality earnings and AI exposure remain our favorite, particularly sectors like IT and Telecom/Media. A Fed pause is historically a positive environment for equities, with Large Caps outperforming Small Caps and International equities. Growth outperformed Value in every previous “Fed Pauses” except for the Dot-Com Bubble (dating back to 1995)
- … But recent divergence in “Magnificent 7” will likely continue: The release of ChatGPT in late-2022 led to outperformance of all “Magnificent 7” stocks in 2023.
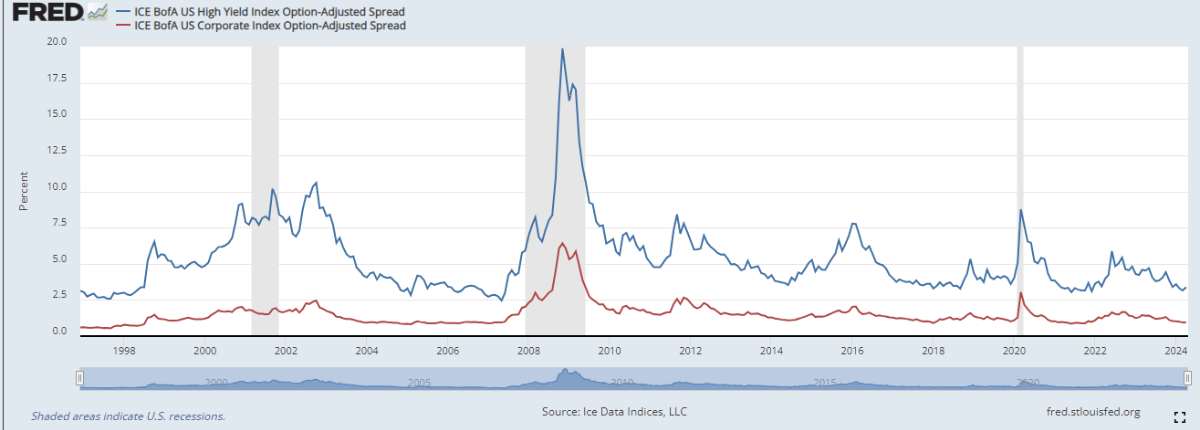
Entering 2024 we believe investor focus will turn from “hype” to “results.” Specifically which company will be able to best monetize AI (or least show a clear path to monetization)? Early winners in 2024 include Nvidia and Meta, while the early losers include Apple and Tesla. We expect divergence in Big Tech performance to continue. As a result, investors should have some level of active management in equities - Be selective in Fixed Income: We continue to prefer short-term government bonds in-line with the “higher for longer” theme. After a ~65bps widening across the yield curve, we are constructive in intermediate bonds and neutral in the long end, where we expect significant volatility. We are less excited about credit risk, with both investment-grade and high yield spreads trading at tight levels. (See below) We don’t think we are getting paid well enough for the increased risks inflation and continued high rates pose to corporate balance sheets. We would recommend high yield municipal bonds to diversify and increase yield in portfolios
- Cash remains king: Uncertainty around inflation and Fed policy has increased with the latest inflation data. With cash earning a ~5% yield, we like having above
average cash balances as dry powder to opportunistically deploy when there are market dislocations without denting returns - Commodities and Private Credit as diversifiers: Economy and inflation that refuse to slow down as well as geopolitical tensions have lifted oil and gold, while green infrastructure investments provide growing demand for industrial metals. Commodities can be a solid portfolio diversifier at this juncture. Private Credit remains attractive with strong demand, limited supply and high yields, particularly for 2023/24 vintage loan portfolios that have been underwritten at the current high-rate environment.
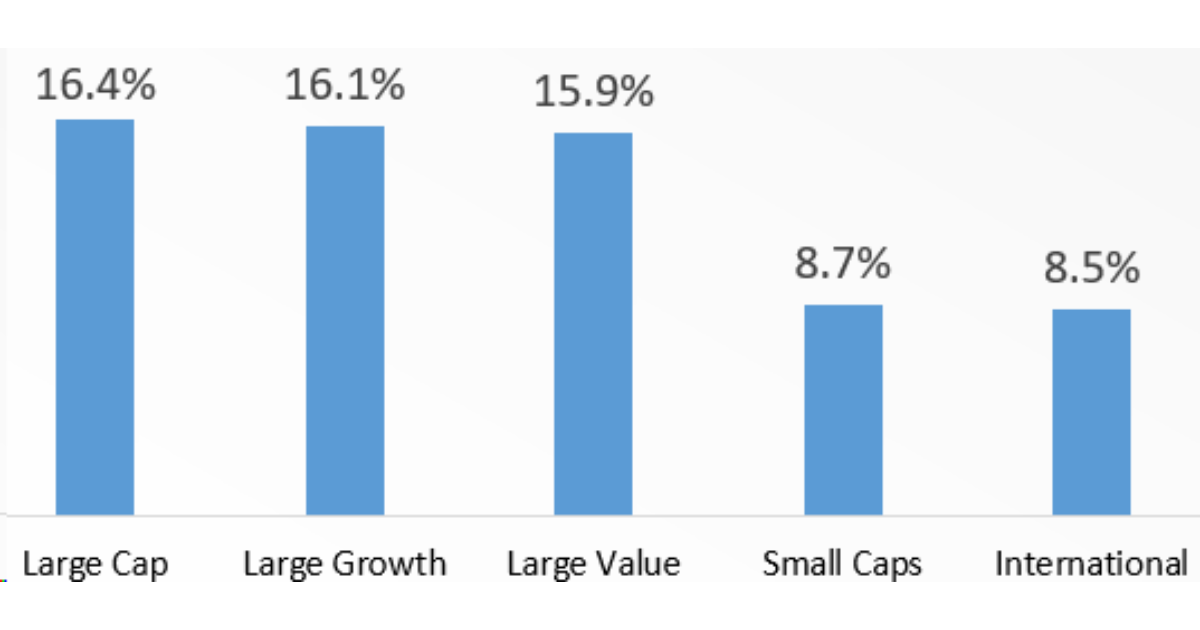
Source: US Federal Reserve, Bloomberg and Dynasty Financial Partners As of 3/31/2024
Large Cap: S&P 500, Large Growth: Russell 1000 Growth, Large Value: Russell 1000 Value, US Bonds: Bloomberg US Agg, Small Cap:
Russell 2000, International: MSCI EAFE, US High Yield: Bloomberg US High Yield 2% Issuer Cap, Cash: Bloomberg US Treasury Bill 1-3 Month

Source: Bloomberg, YCharts and Dynasty Financial Partners (As of 3/31/2024)
“Magnificent 7”: Apple, Microsoft, Amazon, Nvidia, Alphabet, Meta and Tesla
Appendix: Historical Performance During a Fed “Pause”
Asset Class Performance Between the Last Fed Hike & First Cut (1995-2024)
Source: US Federal Reserve, Bloomberg and Dynasty Financial Partners
As of 3/31/2024
Large Cap: S&P 500, Large Growth: Russell 1000 Growth, Large Value: Russell 1000 Value, US Bonds: Bloomberg US Agg, Small Cap: Russell 2000, International: MSCI EAFE, US High Yield: Bloomberg US High Yield 2% Issuer Cap, Cash: Bloomberg US Treasury Bill 1-3 Month
Important Disclaimers and Disclosures
This document is for the viewer’s private and confidential use only, and not intended for broad usage or dissemination. This material is proprietary and may not be reproduced, transferred, or distributed in any form without prior written permission from MAXIMAI Investment Partners and Dynasty Financial Partners, who reserve the right at any time and without notice to change, amend, or cease publication of the information contained herein. MAXIMAI is providing this market update for informational purposes. Although this information has been prepared from sources we believe to be reliable, MAXIMAI has not in all cases independently verified such information. The views expressed in the referenced materials are subject to change based on market and other conditions. This document may contain certain statements that may be deemed forward looking statements. Any such statements are not guarantees of any future performance and actual results or developments may differ materially from those projected. Any projections, market outlooks, or estimates are based upon certain assumptions and should not be construed as indicative of actual events that will occur. The information provided does not constitute investment advice and is not a solicitation to buy or sell securities. This market update does not take into consideration an investor’s specific investment objectives or risk tolerance.
Investments, products, strategies or services discussed are not intended for offer, sale or distribution in countries or jurisdictions where not permitted by applicable law. This content may not be modified, distributed or otherwise provided in whole or in part without MAXIMAI’s express authorization. Nothing in these materials is intended to be, and you should not consider anything to constitute investment, accounting, tax or legal advice.
All investments carry risk of loss. Different types of investments involve varying degrees of risk, and there can be no assurance that the future performance of any specific investment, investment strategy, investment model, or products, including any investments, investment strategies or investment themes referenced in these materials, will be profitable, could be achieved or that similar results could be attained in the future, be suitable for a particular portfolio or individual situation, or prove successful. Investment results will fluctuate and may be highly volatile, particularly over the short term. Diversification does not protect against loss. Due to various factors, including changing market conditions and/or applicable laws, the content may no longer be reflective of current opinions or positions.
Investments or strategies discussed in this presentation, such as private offering or private equity may be speculative, illiquid and carry a certain degree of risk that may only be borne by those who understand and can sustain the risk of loss of their entire investment. The possibility exists that there may not be a secondary market for certain investments and clients should be prepared to bear the risk of holding their investment indefinitely, without the possibility of selling. ETFs or Exchange Traded Funds, are marketable securities that track an index, commodity, bonds, or a basket of assets like an index fund. Unlike mutual funds, ETFs trade like common stock on a stock exchange. ETFs experience price changes throughout the day as they are bought and sold. Mutual Funds and ETFs are sold by prospectus/offering document. Please consider the investment objectives, risk, charges and expenses carefully before investing. The prospectus/offering documents, which contains this and other information, can be obtained by contacting your Advisor. Read the prospectus/offering documents carefully before investing. MAXIMAI is an SEC registered investment advisor located in Coral Gables, Florida. Any references to the term “registered investment advisor” or “registered” do not imply that MAXIMAI or any person associated with MAXIMAI have achieved a certain level of skill or training.
