A Tale of Three Markets in 2023
- January – July: Markets rallied to start 2023, in part due to:
- Lower Valuations and buzz around Artificial Intelligence
- A flight to safety in Big Tech due to the Banking Crisis
- August – October: Bad news hit the markets, including:
- Fitch Downgrade of US Debt Rating
- Property Crisis in China
- Surging Treasury Yields, US Dollar and Oil Prices
- November – December: Markets Rallied into Year End due to:
- Declining Treasury Yields, Inflation, Oil Price
- “Powell Pivot” and belief the Fed tightening cycle is over

Source: Morningstar Direct & Bloomberg
*As of 12/31/2023
Large Cap: S&P 500, Large Growth: Russell 1000 Growth, Large Value: Russell 1000 Value, Small Cap: Russell 2000, International: MSCI EAFE, Emerging Markets: MSCI EM, US Bonds: Bloomberg US Agg
2023 Winners & Losers
| WINNERS | LOSERS |
| Artificial Intelligence | Long Duration Treasuries |
| ChatGPT hit 100 million users in just 5 days and the AI race officially began, with Nvidia & Microsoft among the winners | Long duration Treasuries (as measured by iShares US 20+ Year Treasury) hit 50%+ drawdowns due to rising rates |
| Federal Reserve | Regional Banks |
| Could the Fed orchestrate a “soft landing” for the economy after peak inflation of 9.1%? The market believes so based on the progress so far | Silicon Valley Bank and Signature Bank were the second and third largest bank failures in US history, respectively |
| Japan | China |
| Japanese equities rallied roughly 20% on strong economic growth and friendly corporate reform for investors | A failed Covid reopening and housing crisis weighed on the second largest economy in the world |
| “Magnificent 7” | Oil |
| Big Tech rebounded after a dismal 2022, with Nvidia (+239%) and Meta (194%) and Tesla (101%) the best performers | Oil prices finished negative on the year, in part due to record US production and a weakening Chinese economy |
| India | Congress |
| Markets rallied to all time highs over strong economic growth, with GDP hitting 7.6% in most recent quarter | A downgrade of the US Credit Rating, an ousted House Speaker, and a looming Government Shutdown early in ‘24 |
Source: Morningstar Direct, Bloomberg, Bespoke Investment Group and Dynasty Financial Partners
As of 12/31/2023
S&P 500 Approaching All Time Highs
- Four themes dominated 2023:
- Artificial Intelligence
- “Magnificent 7”
- Federal Reserve
- Inflation
- The S&P 500 ended the year on a nine week winning streak, its longest since 2004.
- US Small Caps and Bonds were both negative YTD though October, but significantly rallied into year end on the hopes of a “soft landing” and rate cuts.
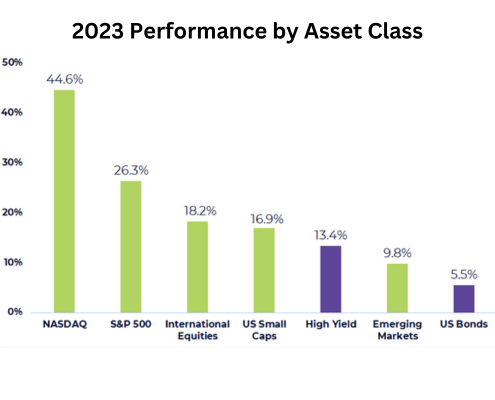
Source: Bloomberg, Morningstar Direct and Dynasty Financial Partners
As of 12/31/2023
International Equities: MSCI EAFE, US Small Caps: Russell 2000, High Yield: Bloomberg US High Yield 2% Issuer Cap, Emerging Markets: MSCI EM, US Bonds: Bloomberg US Agg Bond
Key Indicators Signaling a “Soft Landing”…
- The market is pricing in a “soft landing” for the economy, in part due to:
- Strong Labor Market
- Falling Inflation & Oil Prices
- Narrow Credit Spreads
- Resilient Consumer & Housing Market
- Recession risks include:
- Households Running Out of Excess Savings
- Student Loan Repayments Restarting
- Stickier Inflation
- Rising Consumer Delinquency Rates
- Slowing Bank Landing
- Slowing Job Growth

Source: Bloomberg and Dynasty Financial Partners
As of 12/31/2023
…but the Inverted Yield Curve Continues to Signal a Recession
Every US Recession since the 1950s has been preceded by an inverted yield curve. The 10 year and 3 month yield curve is closely watched by investors and first inverted 419 days ago*. History shows a Recession begins much later after a yield curve initially inverts. In fact, the average number of total days from the first date of inversion to the start of a Recession has been 589 days (dating back to t he late 1960s). This leaves the current inversion period well below the historical average of when a Recession would begin.

* As of 12/20/2023
Source: Bespoke Investment Group
Inversions followed by same Recession
Note: Data highlights first inversion with no other inversions in prior twelve months.
The “Powell Pivot”: Major Change in Fed Language
Monetary policy historically operates with a lagged effect on the economy. This makes it much tricker for Fed officials to determine when to stop raising rates, but it’s clear from the Fed’s most recent meeting that officials are now focusing on rate cuts in 2024 . To highlight the “Powell pivot”, we compare key quotes below from Fed Chair Powell’s press conferences in November & December.
Notable Quotes from Fed Chair Powell’s Press Conference:
November 2023
- “We’re not confident yet that we have achieved such a sufficiently restrictive stance.”
- “Inflation has been coming down, but it’s still running well above our 2 percent target.“
- “The fact is the Committee is not thinking about rate cuts right now at all. We’re not talking about rate cuts.“
December 2023
- “We believe that our policy rate is likely at or near its peak for this tightening cycle…“
- “Want to be reducing restriction on the economy well before 2 percent…so you don’t overshoot…“
- “Question of when it will become appropriate to begin dialing back the amount of policy restraint in place, that begins to come into view…and a discussion for us at our meeting today.“
Source: US Federal Reserve
As of 12/31/2023
The “Powell Pivot”: Rate Cuts Expected in 2024
The “Powell Pivot” was also on full display when the Fed released their quarterly “Dot Plot” at the December meeting. The “Dot Plot” summarizes where FOMC members expect the Fed Funds Rate to finish in future years.
As shown to the right, a majority (6) of FOMC members expect 75 basis points of cuts in 2024. However, the market is currently pricing in 150 basis points of cuts in 2024. Once again, market expectations differ from the Fed.
The markets are also pricing in a 78% chance the first rate cut will occur at the March 20th meeting. Given the runup in equity prices and loosening financial conditions, we believe the Fed will do its best to hold off cutting rates until the second quarter at the earliest. We also think that ultimately there will be ~75bps of cuts as opposed to the ~1.5% market expectation.

Source: US Federal Reserve & CME FedWatch Tool
As of 12/31/2023
Fed Projections are from December 2023 meeting
Historically How Long Until the Fed Cuts?
As the market turns its attention to rate cuts, the next question is when will the Fed begin cutting interest rates? In looking back over the past 30 years, the Fed has averaged roughly 10 months between the last hike and first cut. Given the last rate hike in this cycle occurred in July 2023, this would put the Fed on pace to beginning cutting in May 2024. It’s important to note the Fed historically h as cut as early as 5 months after the last hike, and as late as 18 months (dating back to 1995).

Source: US Federal Reserve & Bloomberg
As of 12/31/2023
Projection for May 2024 Rate Cut is based on historical average between last Fed hike & first cut
What about Private Markets?
Valuations have come down in both middle market private equity and venture capital from recent peaks…
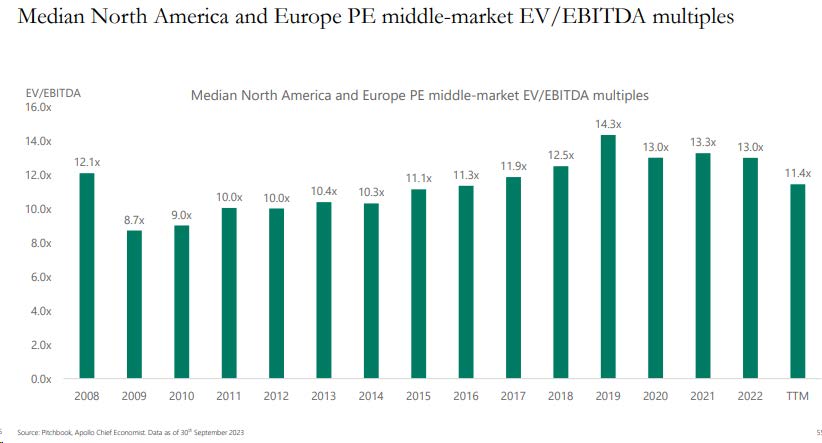
Source: Apollo
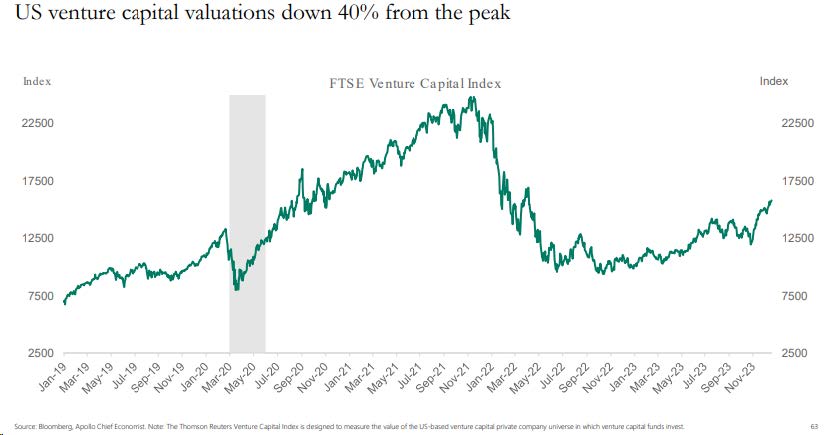
Source: Apollo
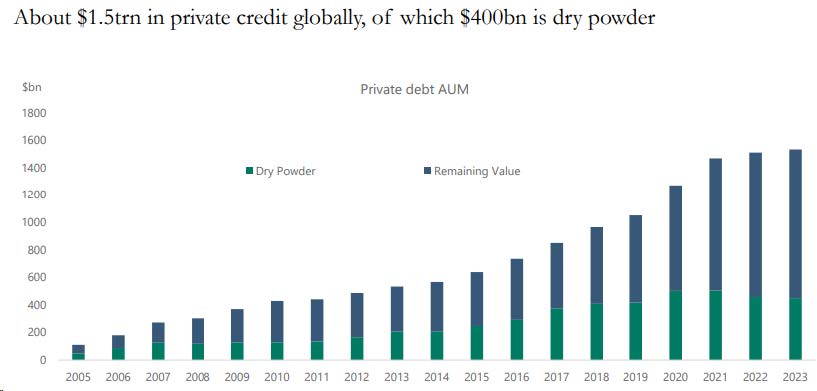
… while the addressable market in private credit has expanded significantly over the past decade, as banks and public lenders have moved away from the middle market due to regulatory pressure.
Investment Implications
1. Expect volatility to return in 2024:
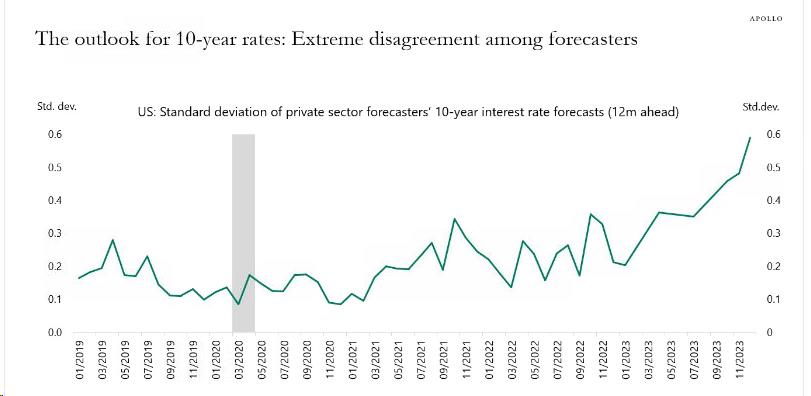
Volatility was historically low in 2023 despite major geopolitical events and a hawkish Fed. In 2023, there were only two trading days where the S&P 500 saw 2% moves compared to 46 trading days in 2022. We expect volatility to return in 2024. Underpinning our expectation is the extreme disagreement among forecasters as well as the Fed regarding the direction of the interest rates
Source: Apollo
2. Fixed income is attractive:
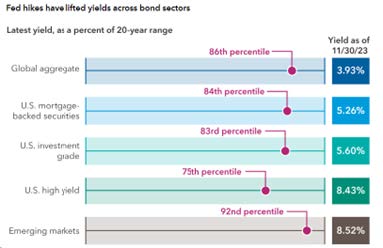
Persistent inflation, large budget deficits and increasing treasury issuance pose upside risks to yields. However, yields are near 20 year highs across various fixed income assets and offer attractive risk adjusted returns…
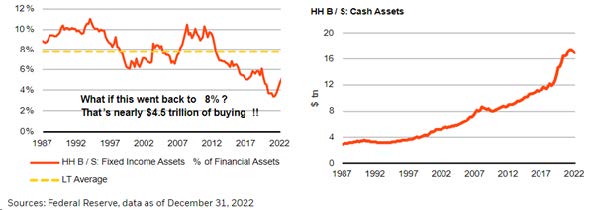
… US households are holding a large amount of cash and are under allocated to fixed income, which, combined with high yields and looming economic uncertainty could provide a technical tailwind to fixed income.
3. US Large Caps outperform during a Fed pause:
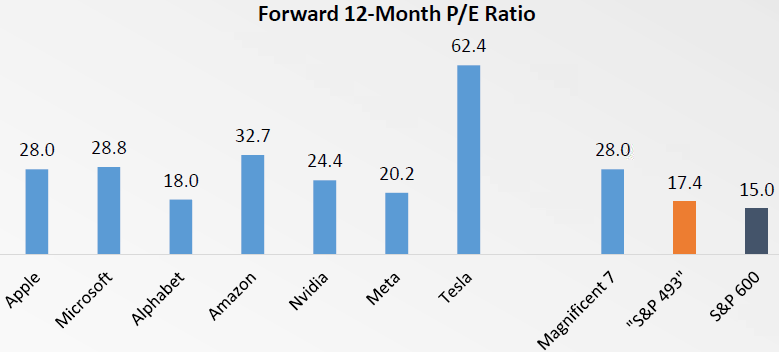
The outperformance in Big Tech and Large Caps in 2023 has led to higher valuations. Let’s distinguish, however, between the Magnificent 7 and the broader S&P 500 index:
The Magnificent 7 have forward P/E ratios between 18x and 62x earnings, averaging a lofty 28.0x P/E valuation. If we strip out these seven names, the remaining stocks in the S&P 500 have a median forward P/E of 17.4x, a much more reasonable figure.
A Fed Pause has historically been a positive environment for equities, with Large Caps outperforming Small Caps and International equities. Large Value was the best performer and was positive during every “Fed Pause,” including the Dot Com Bubble (dating back to 1995).
Given the starting point in valuations, we like S&P 493 going into 2024. Within Large Cap, we continue to favor Quality over both Growth and Value.
Source: Bloomberg, YCharts, Bespoke, US Treasury Department and Dynasty Financial Partners
As of 12/31/2023
Median 12 Month Forward P/E is used for “Magnificent 7” and “Rest of S&P 493”
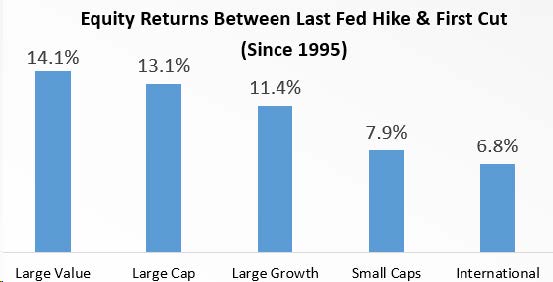
Source: US Federal Reserve & Bloomberg
Large Value: Russell 1000 Value, Large Cap: S&P 500, Large Growth: Russell 1000 Growth, US Bonds: Bloomberg US Agg, Small Cap: Russell 2000, International: MSCI EAFE, US High Yield: Bloomberg US HY 2% Issuer Cap, Cash: Bloomberg US TBill 1 3 Month
Fed Pause Dates: 2/2/1995 – 7/5/1995, 3/26/1997 – 9/28/1998, 5/17/2000 – 1/2/2001, 6/30/2006 – 9/17/2007, 12/20/2018 – 7/30/2019
4. Small Cap and International stocks look cheap but be selective when investing in them:
Both Small Cap and International valuations look cheap compared to US Large Cap. We recommend a diversified portfolio with balanced exposure to Small Cap and International stocks. It is important to note that active management adds more value in these markets.

Source: KKR
5. Add private alternatives to traditional 60/40 portfolios:
Increased expected volatility and moderating valuations render private alternatives as a valuable option to diversify traditional 60/40 portfolios. Historically, Private Equity has had the greatest excess return when volatility is high and expected public market returns are moderate:

Source: KKR
Appendix: Historical Performance During a Fed “Pause”

As of 12/31/2023
Large Value: Russell 1000 Value, Large Cap: S&P 500, Large Growth: Russell 1000 Growth, US Bonds: Bloomberg US Agg, Small Cap: Russell 2000, International: MSCI EAFE, US High Yield: Bloomberg US High Yield 2% Issuer Cap, Cash: Bloomberg US Treasury Bill 13 Month
Important Disclaimers and Disclosures
